Using Count Plots to Adjust Stand Tables and Tree Listsby David Marshall and Kim IlesUsing count plots is a well known way to increase efficiency in estimating volume for variable plot cruises. This is because basal area is almost always more variable than the "Volume to Basal Area Ratio" of measured trees (see "Count Plots in prism cruising a simple money saver" in Issue 4). Because many people use count plots, we often get questions about whether count plots can be used to improve stand tables or to improve tree lists used in growth models. The answer is "yes, count plots can be used for this." In fact, we do this for the stand tables computed at the OSU short course each year. To demonstrate, let’s use data from a 20 BAF cruise with 25 sample points. The odd numbered plots were count plots, and on the even numbered plots all trees were measured for DBH to the nearest 1/10 inch. Basic information on the tree counts is given in the table below.
Adjusting Stand Tables for Count Plots In the table below shows the average tree count on the 12 measured plots by 2-inch diameter classes with the resulting stand table (trees per acre). The trees per acre in each diameter class are computed using the average tree count for trees in that diameter class on all measured plots in column 3. As an example, the following is the computation for the 16.0 to 17.9 inch class with 14 trees on the 12 measured plots: TPA class = average tree count * expansion factor = trees/acre
To compute basal area for the 16.0 to 17.9 inch class we can use the mid-class diameter, or 17-inches (0.005454154 * (17 inches)2 = 1.5763 square feet). The number of trees per acre in each diameter class is shown in column three of the table below.
The problem is that the total basal area from the trees in column 3 would only be 123 ft2/acre compared to 132 ft2/acre for all the plots (which we corrected in column 4, and will now explain). Some difference is expected, because there is a small difference in the average tree count for the measured and the count plots for this cruise. This is just the way it was for this cruise and we would expect the averages to be the same over a large number of cruises. Since we expect the basal area estimated from all the plots will be a better estimate (it is based on more plots), how can we use this additional information to improve our stand table? The adjusted trees per acre are computed by a constant adjustment computed from the two ratios:
This adjustment can be applied to all classes. For the 16.0 to 17.9-inch class this would give an adjusted estimate of
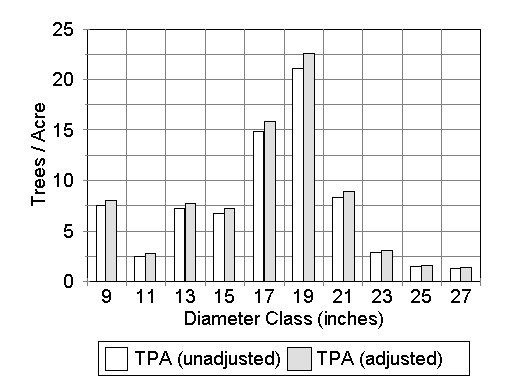
The adjusted number of trees per acre for each diameter class is shown in the fourth column of the table above and the adjusted and unadjusted stand tables are compared in the figure below. Notice that the trees per acre and the basal area are greater for the adjusted stand table and that the basal area per acre estimate is 132.007 ft2/acre. This is the same as the estimate from the average tree count using all the sample points (with a little rounding error). Adjusting Tree Lists for Count Plots
In this case, the Number of Plots is the number of measured plots (12 in our example). In the above cruise we have a tree with a measured DBH of 17.7 inches on one of the measured plots. The expansion factor (based on the 12 measured plots) is 0.975 trees/acre using the equation above. Using our 1.07027 adjustment computed for the stand table example above, we get an adjusted expansion factor of: .975 trees/acre * 1.07027 = 1.044 trees per acre for that tree. All the trees in the tree list would be adjusted in the same way. As you might expect, if we added up the adjusted expansion factors for all our trees we get approximately 79 trees per acre and 132 ft2 of basal area per acre. Actually, we prefer doing this individual tree expansion for stand tables as well, to eliminate rounding error. To get the class total, add the individual numbers in that class at the end of the process. One caution about adjusting tree lists is that some growth models expect that the trees per acre estimates (or expansion factors) entered are at the plot level – in other words, the model will divide by the number of plots (No. Plots in the equation above). Know what the model you have will do with the data you give it. |


