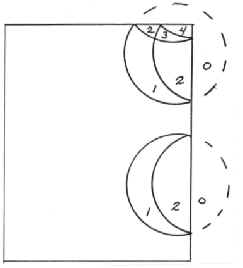
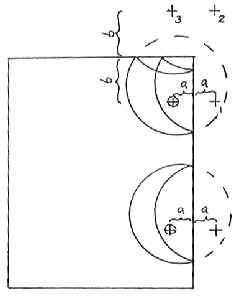
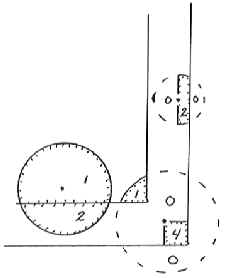
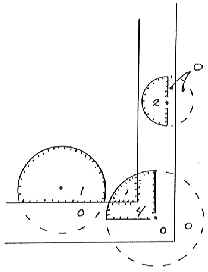
Edge Effect in Forest Sampling (Part I)Kim Iles, Inventory Consultant This is a nasty problem. It is also a practical one, and should be of interest to anyone planning an inventory. First, let’s talk about the nature of the problem and the historical solutions. What is the Problem? Suppose we have a circle around each tree (which is a useful way to look at both Fixed Plots and Variable Plots). We select the tree for sampling when a sample point falls inside that tree’s circle. Naturally, we often fall within several circles at each sample point, and therefore select several trees at a time. When the tree is near the edge of the stand, a portion of its circle will fall outside the stand we are sampling. When we choose points inside the polygon, there is no chance of falling onto that portion. Therefore, we select that tree less often than we should, because part of that tree circle has “fallen off the earth” as far as our polygon sample is concerned. The same thing happens when we have internal small areas such as roads and clearings that are “typed out” of the polygon area. If sample points are not selected there, any parts of tree circles falling over them are ignored. Can it be Avoided? For Fixed Plot or Variable Plot sampling, you are stuck with this problem. As stands become smaller, more irregular, and have more “internal holes” this problem gets worse and worse. For 3P sampling, edge effect does not occur, so that is one more reason to use 3P sampling when the area is small enough, or you visit every tree anyway. For other sampling methods, you need a solution, or a proof that the bias is not large. Ignoring the problem will not make it go away. Some people just refuse to sample near the edge. That’s a bad idea in almost every situation. In this case the chance of selecting edge trees has gone to zero. What are the chances that the average of every kind of measurement (when you ignore the edge) will still be the same? If you have done studies using a biased approach and one which is correct, then you might prove that the average is very similar either way. If you have done that, then I believe that the issue of having an acceptable average is addressed adequately. We often have small biases in forestry that we must accept in order to have practical methods of field work. We just have to know that the bias is small, by testing it. The Tree Data Even if the average is OK, the relative selection probabilities of the trees are still not correct, and you do not have a valid sample of the trees in your population. For a valid sample, you have to know the probability of sampling an item. For future research, and databases used for other purposes, that issue remains a problem. If possible, it would be nice to solve it. There are several reasons to want a valid sample of the trees in your area. All kinds of research is done these days on “available data.” It would certainly be nice if all sample trees were properly represented in that data. In many cases, databases should have a factor that represents the number of trees represented by each sample tree. Correct Procedures Partial Weighting If you cannot select the tree with the right probability you can weight the result. If 1/3 of the tree circle falls outside the polygon you are sampling, you can weight the characteristics of the tree whenever you do get it. Since you are only selecting it 2/3’s as often, you weight it by [3/2 = 1.5] when it is chosen. If a tree that size would normally represent 50 trees/acre, it would now represent : (50 trees/acre*1.5 = 75 trees/acre). The extra weighting (multiplier) is: Weight = 1.5 How do you find the amount of the tree circle falling outside the polygon? Not easy. You can imagine that if you had a nice straight edge, and could measure the distance to each tree, then geometry could calculate the area of the partial circle on the far side. The field crew would measure the distance, and the compilation program would handle the math. What about actual curved and indistinct boundaries? A very messy process indeed. This method is seldom used in practical work. Selection Weighting If you could “fold back” the tree circle into the stand then all the trees would have the correct probability. You can image this as a round tarp that you can actually fold back at the plot boundary. In this case the tree might be selected twice if you landed on a “doubled” section of the tarp, and this makes the computation easy. Just enter the tree twice in the sample data. Near a right-angle corner you might fold the tarp twice, and have a possible count of 1, 2, 3 or 4. The illustration below shows this. “Folding” is the idea behind the “Mirage Method”. Instead of physically folding back the tree circle, you do the equivalent by the following technique. Measure the distance at a right angle to the polygon edge, and go that far outside the polygon. Then use an angle (for VP) or a distance (for FP) and see what trees are chosen from these outside points. (Note the additional point at corners) Each tree “in” from each “mirage” point is also entered onto the plot card of their original sample point. This is because you have determined that the original sample point landed on the invisible “folded back” portion of those tree circles. Only one distance is involved (sample point to each polygon edge), which is less trouble than the “partial weighting” process for each tree. What about curved or indistinct boundaries, non-square corners, and internal “holes”? Bad news. The process either breaks down completely or is too much hassle. A very nice idea, but short of the mark on a practical basis. Incorrect Procedures (That are often used anyway) “Half-Sweeps” are a common way to do this. Instead of taking trees in a 360 degree sweep, you do a 180 degree sweep and double the result. The idea is to fold the tree circles, along their midpoint. Lew Grosenbaugh did this years ago (quite correctly, using a few additional rules and procedures), but the common cruising methods described here are not quite correct. Even so, it is a simple and practical solution, and nobody has yet reported it (in the biometrics journals) as a serious error. The Mirage method is slowly replacing half-sweeps, but it is not clear that the Mirage method is actually superior under practical circumstances, or that the extra effort is justified. In practice, when sample points are “too near” the polygon boundary the cruisers will use a half-sweep. This defines an “edge band” in the polygon where a half sweep will be used, as opposed to the interior of the polygon which will use a full 360 degree sweep. Do you make the half-sweep towards the inside of the stand, or towards the outside? It is not obvious, but the most correct procedure may be to sweep towards the outside of the stand. It is pretty hard to do this, psychologically, but I will explain the geometry so you can understand the reasoning. You have to remember that the tree circles are “folded” in the opposite way you do the sweep. When you are near the edge, and do a sweep toward the center, you will only see trees which are on the interior side of that sample point. In the following illustrations the number of times the tree would be duplicated on the plot card is noted in each of the areas around the trees. “Interior Sweep” See the illustration that follows. This shows that the trees near the polygon edge are hardly ever chosen. Many of the probabilities for those trees are more biased than they were before. In addition, some of the other trees have increased probabilities. The probabilities depend upon the size of the tree circle and the width of the edge band around the polygon. Averages using this method could be positively or negatively biased. Even if the changed probabilities cancel out (on the average) for basal area, the individual tree selection can be even more badly distorted by this process than it originally was. On the other hand, perhaps you are content with the basal area or volume being approximately correct. The bias is different for each tree measurement (VBAR, value, etc.). “Exterior Sweep” If you sweep towards the outside of the polygon, the tree circles are folded toward the polygon. The trees near the inner side of the “edge band” still have incorrect probabilities. Here again, we can have a positive or negative bias (I believe that the tendency is to have a larger basal area, and probably less bias with this method). Still, the tree probabilities are not correct, and there is a bias. How large is this bias? Nobody knows, unless they have done a study to find out under local conditions.
What else could you do? In the next issue I will discuss a way to solve this problem. It works with curved boundaries, interior hoes, and all you need to know is if you (or the tree) are inside the polygon -- not where the exact edge is. This is a solution presented at the Montana Western Mensurationists Meeting, and discussed in short courses for a number of years. |


