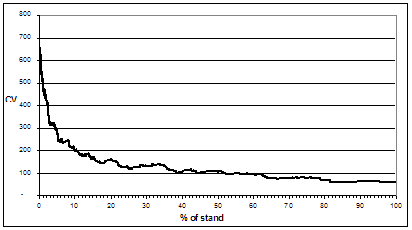
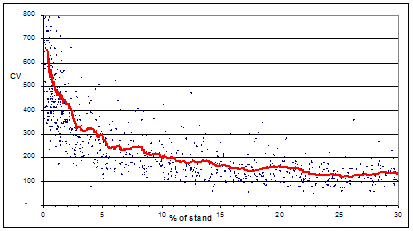
How Variable are Minor Stand Components?Good question. We all know the general answer - pretty variable. Too variable to get good answers, in many cases - on the other hand if they are minor, maybe it does not matter that much. As we often say - the answers are in your files. Let's take a look. J.S. Thrower and Associates (http://www.jsthrower.com), in British Columbia have a group that does compilations for various companies. They are doing some innovative compilation procedures, including some of the methods we have discussed in the Newsletter. We asked Jim Wilson, who is in charge of compilations, if he could illustrate the situation with a graph we thought was easy to interpret and useful. His staff did, and they have kindly given us permission to show the results. The trends are similar for many species, but this particular set of data is from the BC interior, and is a mixture of species. Graphs #1 and #2 show the CV for a species which is a given percentage of the overall stand. The data shows the spread around a rough average produced by the EXCEL program. As a general interpretation: " At 50% composition expect 100% CV " At 10% composition expect 200% CV " At 5% composition expect 300% CV " At 2% composition expect 400% CV Also, expect plenty of variation around those rough guidelines. If your computation program produces SE% for each species, you can work backward to get the CV by the formula:
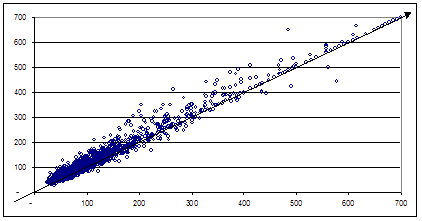
"n" is the total number of plots, and "SE%" is for a "t-value" of ONE. For the t=2 or "Sampling Error at the 95% value", you can divide by 2 as a reasonable approximation for ONE SE%. Another interesting sideline was that they computed the variability of the trees per hectare. The CV was less variable for numbers of trees than for Basal Area (which is the same as tree count). This is the reverse of what you often hear people saying about Variable Plot Sampling. The third graph shows this relationship between the CV for Basal Area and for number of trees per hectare or acre. As you can see, they are very similar, meaning you know the number of trees about as well as you know the stand basal area. The reason that the answers are the same at very high CVs is that you are often dealing with a single tree being observed, and so the results are identically troublesome. This is the simple kind of comparison that can be done with data currently available to many organizations. There are very few practical questions that cannot be approximately answered with data already in your files. Some compilation programs, of course, make that data easier to get hold of. We want to thank J.S. Thrower & Associates, and Gyula Gulyas especially, for producing this useful and informative graph.
|


